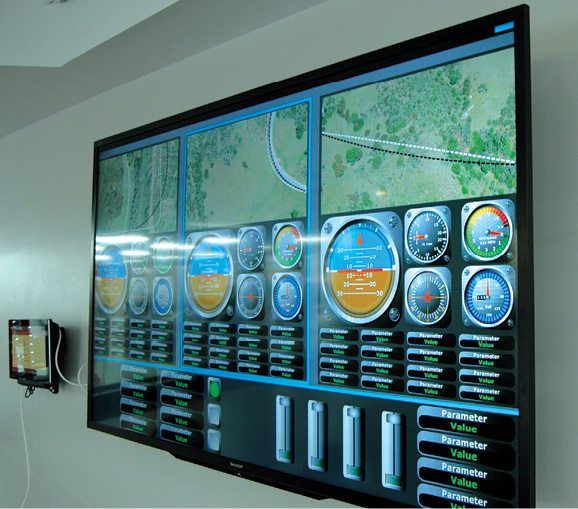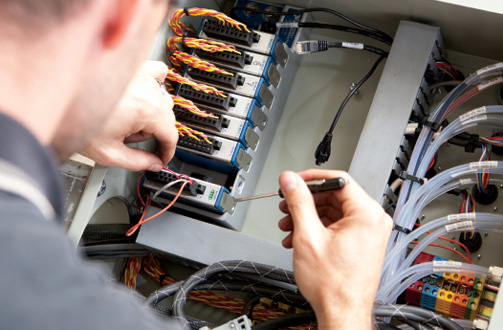
Data acquisition devices enable real-time visualization dashboards. Image courtesy of XAir Corp.
March 1, 2018
Jaguar Land Rover (JLR) is the parent company of two iconic British car brands known for rugged design and luxury. Their more than 400 engineers who work in the powertrain calibration and controls department have access to huge volumes of raw test data to make smarter decisions before a vehicle goes to market.
Using data acquisition (DAQ) devices and software, they created a fully automated analysis routine that helps design engineers make smart decisions and improve the time it takes to arrive at those decisions by 20-fold.
“Within one year of developing and implementing this solution, we estimate that we now analyze up to 95% of our data and have reduced our test cost and number of annual tests because we do not have to rerun tests,” says Simon Foster, powertrain manager of Jaguar Land Rover.
A DAQ is typically an electronic device that records data within a specified time frame relative to some variable such as location. It achieves this with an integrated sensor or external instrumentation of sensors and is usually linked to a digital processor.
50 Billion Devices by 2020
The market research firm Technavio forecasts the global data logger market to grow at a compounded annual growth rate of almost 12% between 2017 and 2021, according to its latest report.
 Data acquisition devices enable real-time visualization dashboards. Image courtesy of XAir Corp.
“The function of data loggers in automated systems can be summarized into test, measurement and control functions,” says Chetan Mohan, a computing devices research analyst at Technavio. “For example, a specific temperature needs to be maintained in a cold storage warehouse; hence, data loggers are connected to automated systems that increase or decrease the effect of cooling to maintain the specific temperature.”
National Instruments, which designs and fabricates data acquisition devices and licenses software to use in conjunction with them—including that of Jaguar Land Rover, believes the market for data acquisition devices is robust. The company cites Cisco, who predicts there will be 50 billion connected devices by 2020.
National Instruments cites processing industries that use data to monitor their operations to prevent downtime and boost efficiency. They note that data gathered ranges from basic information such as temperature and pressure to more complex data that can be challenging—such as waveform vibration data. For example, to identify higher orders of vibration faults on rotating machinery you often need a sampling frequency of 50kHz or more. These specifications require conditioned measurement systems with enough processing power to perform analysis at the edge of the network.
 National Instrument’s CompaqDAQ is a portable DAQ platform that integrates connectivity and signal conditioning into modular I/O. Image courtesy of NI.
“Operational data in the last few years has moved from a want to an expectation,” says Graham Green, group manager of Product Marketing for National Instruments in Austin, TX. “There is a divergent trend in the devices used to gather this data. On the one side, the maker market is driving down the cost of small, cheap computational platforms such as Raspberry Pi. These can be combined with a measurement ‘hat’ available from multiple vendors to allow distributed data logging at a very accessible price.
“The challenge here is that the measurement quality is low, and sometimes even unspecified, which threatens the trust that engineers can have in the data they acquire,” Green continues. “On the other side, the need for ‘edge ready’ measurement devices that have the capability to acquire accurate waveform data, perform some analysis at the edge and be deployed in harsh environments is also on the rise. These often come at a higher price point, but wide adoption is still being seen, especially in industries where either the core infrastructure is expensive such as power generation, or the cost of downtime is high such as manufacturing.”
Understanding DAQ
Seshu Kiran GS is a consulting engineer and the founder and CEO of XAir in Los Angeles, CA. He explains that DAQ, from an industrial perspective, refers to process control and automation, thus the term SCADA systems is frequently used (supervisory control and data acquisition). So, DAQ is meant for visualizing the process data and controlling the process variables.
He adds that DAQ related to design testing purposes could have different meanings or purposes. It could refer to validation, for example, testing electronic circuitry parameters, and it may also refer to other applications like automotive noise and vibration analysis or aircraft non-destructive testing (NDT).
Kiran explains that DAQ system functions are three-pronged: acquire, analyze and present. More specifically: acquire—digitize and acquire the data; analyze—compute digital signal processing, or math or logical functions on the DAQ board itself, or in a post-analysis software; and present—in an intuitive and interactive user interface with recording and storage functions.
Fully Standalone Versus PC-Integrated
“There are some companies that are midway between fully standalone vs. PC-based and highly configurable and programmable,” Kiran says. “The reason to have a midway is this: In PC-based or highly configurable DAQ systems, there is a considerable load on software. Generally, software is not fully deterministic in the timeline of millisecond to microsecond. There is certain function that needs to purely perform in the hardware itself. For example, performing FFT (fast Fourier transform) or any other mathematical operations on a huge data set takes a lot of time on PCs. If it is implemented on the hardware, it can crunch much quickly. Also, there is certain high frequency RF equipment, where a strict dependency on the hardware is needed.”
Data-Driven Future
Data acquisition enables data gathering, which may be used to deliver reports and fill dashboards with useful information.
As for Jaguar Land Rover, thanks to data acquisition hardware and software, engineers may now query and order data to perform an analysis routine on all test results that meet the specified parameters. They may now run a batch process, sometimes on thousands of files, using a predefined analysis routine or can create an ad hoc analysis routine on data that requires closer inspection. The result of any analysis routine is a templated report to help make data-driven decisions more quickly.
Green of National Instruments says the expectations of data move far beyond just the instantaneous operation of any individual asset toward a system-wide view where data can be aggregated and analyzed from multiple connected devices and the opportunity to use a single software product diminishes.
“No one vendor has a product that can span the technology stack of an industrial IoT application nor [does] any one engineer [have] the expertise to code every element from the ground up,” Green says. “Therefore, the key is for vendors to work together and provide software that both abstracts the complexity for their element of the technology stack while ensuring openness and interoperability within an ecosystem of software tools.”
More Info
Subscribe to our FREE magazine, FREE email newsletters or both!
About the Author
Jim Romeo is a freelance writer based in Chesapeake, VA. Send e-mail about this article to [email protected].
Follow DE


