
Latest News
February 1, 2011
By Ian Clark
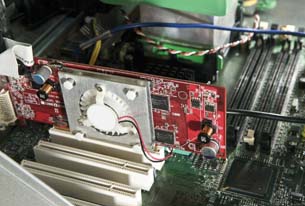 FIGURE 1: The microcooler can be scaled to fit PCB-mounted applications, or into recesses as small as a cell phone’s memory card slot. Image courtesy of Mentor Graphics Corp. |
Makers and users of electronic products of all kinds have been repeating the “smaller, denser, faster” litany for years. And indeed, each new generation of devices delivers these advantages — to the point where a cell phone, for example, can be made as small as any human hand can manage.
One side effect of this continual downscaling is the inevitable buildup of internal heat in all these devices. Low-power semiconductor components and passive heat-sinking schemes have sufficed so far, but now the time has come for active heat removal. For years, CPU chips and graphics processors have used small fans mounted atop the integrated circuit (IC) device. But even these miniature air movers are far too large for some applications on the drawing boards today.
Into this milieu comes an emerging class of microcoolers — fans small enough to fit within a tiny recess, such as the memory card slot of a cell phone. Built into a simple housing that itself acts as a heat sink, a microcooler can be about the size and thickness of a coin. Yet these smallest units can disperse up to 3 watts of heat, and larger versions can move 40 watts and more using integrated heat pipes. As Figure 1 shows, the microcooler dispenses with finned heat sinks — saving cost, space and manufacturing complexity.
The technology evolved after more than five years of extensive research at the Stokes Institute (SI) at Ireland’s University of Limerick. The facility takes its name from George Gabriel Stokes (1819-1903), co-creator of the Navier-Stokes fluid dynamics equations that are at the heart of computational fluid dynamics (CFD) analysis. SI is renowned for its research into thermal phenomena and cooling technologies.
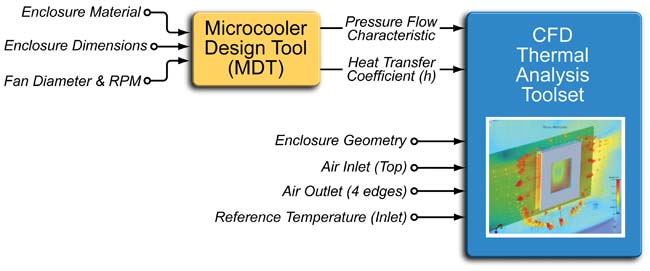 FIGURE 2: CFD thermal analysis works with a compact microcooler model, based on parameters from an external design tool plus user-specified geometries and conditions. Image courtesy of Mentor Graphics Corp. |
SI’s researchers identified a series of previously unreported cooling interactions that could be manipulated to create more efficient thermal management of electronic devices. They discovered an innovative method of combining newly characterized fluidic behavior with specially arranged cooling surfaces. The result is a high-performance, low-profile cooling technology that combines low acoustic noise generation with high reliability and energy efficiency.
Microcoolers open the door to active cooling in the tiniest spaces within electronic systems. Mobile devices stand to gain reliability, as well as new features and greater range. Larger system-level products get new flexibility in printed circuit board (PCB) and enclosure layout, with implications for packaging and physical compactness.
CFD Adaptations
New technologies are tempting, but they can be risky, too. It takes a brave designer to invest his or her reputation — and that of an important new product — in an untried component. But increasingly, designers are learning that it’s not necessary to spend precious development time on hardware prototypes. Instead, they are turning to thermal analysis with modern CFD tools.
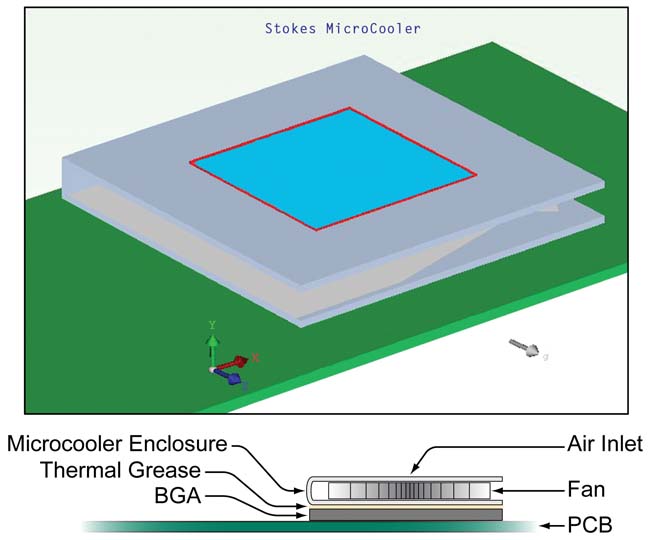 FIGURE 3: A graphic representation of the microcooler compact model. Image courtesy of Mentor Graphics Corp. |
CFD played an important role in the development and validation of the new active cooling architecture, and is the right tool to help designers implement microcooler solutions in their end products. SI researchers worked with in-house design tools and the Mentor Graphics FloTHERM CFD analysis application to predict thermal responses as the fan design evolved.
The key to efficient CFD analysis is a workable compact model. Most models are intentionally simplistic, but they embody the essential properties of the device. The rule of thumb is to optimize the model’s level of detail only to the degree that provides usable results when calculating terms such as thermal resistance.
For example, experience has shown that a simple resistive-capacitive equivalent network model can suffice to describe a rather complex heat flow path. Modeling and analyzing a microcooler is akin to designing a conventional heat sink, though the fan’s active nature — a rotating element forcing air to move — requires a few more details in the definition.
In the process developed by SI researchers, building a microcooler compact model is a two-step operation. It begins with an in-house microcooler design tool (MDT) that accepts a fundamental physical description of the device. Entries include the dimensions (length, width, height, metal thickness); materials that make up the housing (typically, aluminum); fan diameter and height, fan speed and more.
The outputs of this design tool are the pressure-flow characteristic of the fan and, importantly, the thermal resistance of the microcooler, commonly expressed as °C temperature rise per watt. The thermal resistance is also used to extract the effective heat transfer coefficient acting on the microcooler’s inner surfaces. Knowledge of the heat transfer coefficient is what enables a designer to treat a microcooler as a normal heat sink — though an extraordinarily efficient one.
Interestingly, the microcooler is easier to model than the CPU fan/heat sink combinations found in PCs everywhere today. That is because the MDT delivers both the aerodynamic characteristics (how much air the microcooler fan will move) and the thermal resistance as they pertain to one integral unit.
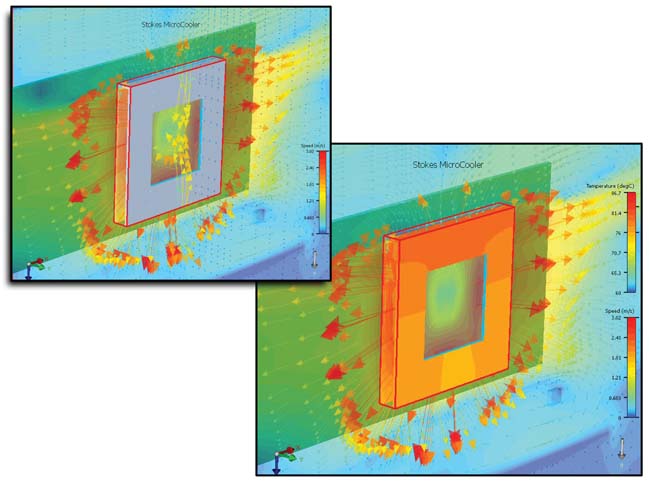 FIGURE 4: Air speed and thermal plots of the microcooler’s behavior under a specific set of conditions. Image courtesy of Mentor Graphics Corp. |
Given the pressure-flow and heat transfer characteristics, the next step is to build a model for a CFD tool such as FloTHERM in preparation for the analysis. The model incorporates as inputs additional fan details and enclosure geometry, as summarized in Figure 2.
Figure 3 depicts the graphic representation of the model from the CFD application. The elevation view shows the semiconductor device and thermal interfaces not included in the model view. The ball grid array’s (BGA’s) semiconductor chip, the epicenter of heat in this analysis, is positioned directly below the center of the microcooler fan.
The Bottom Line |
Note that the fan itself is represented as a square, even though the actual fan is, of course, circular. This is done to simplify modeling and minimize simulation time. After all, this is a “compact” model.
One of the four faces of the square appears to be impeded by the folded edge of the enclosure. But the air coming off the fan itself — its blades — is of interest here, and the closed edge doesn’t prevent air from emerging from the blades.
Proof of Performance
Figure 4 shows a pair of output plots that have been solved by a CFD tool — in this instance, FloTHERM. Both views slice through the center plane of the microcooler.
In the upper view of Figure 4, all the arrows (vectors) equate to air flow speed. Color denotes speed, with red equating to the highest value — about 3 meters/second. Clearly, the microcooler is dispersing volumes of air from three of its edges. Some air goes upward and bounces off the top wall of the enclosure, but is discharged to the right and still contributes to overall cooling. A group of yellow arrows maps the path and speed of the incoming air at the inlet.
The lower view adds temperature data for the enclosure while retaining the speed vectors. Here, the hottest parts of the surface are those closest to the IC component, with slightly lower temperatures toward the periphery of the microcooler. All internal surfaces of the microcooler manifest a very aggressive heat transfer coefficient, however, achieving efficient heat removal.
The interpretation of the plots in Figure 4 depends on the allowable temperature ranges in the BGA and its surroundings. CFD tools provide an expedient means to predict whether component temperatures are acceptable and to analyze air-flow patterns and velocities at the PCB level.
More Info:
Mentor Graphics
Stokes Institute
Ian Clark is product manager for the Mechanical Analysis division of Mentor Graphics Corp.
Subscribe to our FREE magazine, FREE email newsletters or both!
Latest News
About the Author
DE’s editors contribute news and new product announcements to Digital Engineering.
Press releases may be sent to them via [email protected].