Latest News
August 1, 2005
By Sugato Deb
Significant changes in the roles of simulation and physical testing have been occurring as they become further integrated into the product development cycle. Integration of mechanical simulation (CAE) with CAD has simplified the creation of simulations, especially FEA (finite element analysis). However, one of the major challenges remains getting departments not involved in simulation to accept simulation results as the basis for making engineering level decisions. This is where correlating FEA results to physical prototype results can help build FEA simulation credibility.
Physical testing has traditionally been used downstream in the product development process as a pass or fail filter before a product is released to manufacturing. As it moves upstream into the product development process to help validate designs and simulations, its role has evolved to one of helping characterize designs and correlate simulations. While the type of testing has not changed (i.e., stress, strain, temperature, pressure), how the test results are used and by whom are quite different.
Correlation ProblemsSeveral challenges exist in correlating simulations with physical test results. One, there is typically little direct interaction between the testing and simulation groups. This historical divide can be overcome by adjusting the workflow process, but a major technical problem remains in that testing and simulation present information in different manners. Physical test data is typically collected in a waveform data type while simulation typically presents results in 3D geometry. In addition, test data collection locations are sparse compared to relatively dense simulation mesh results. Though a point-to-point comparison between simulation and testing is possible one location at a time, it is a tedious and time-consuming process, especially with the large channel counts possible in today’s test applications.
The problem is that there hasn’t been a common collection and analysis environment for simulations and test results from different vendor products. Such an environment would allow designers, simulation engineers, test engineers, and product development managers to leverage both simulation and test information to make important engineering level decisions.
To fill this gap, I and my team at National Instruments (Austin, TX) developed NI INSIGHT to cover three specific areas needing attention. First, test data needs to be presented in 3D geometry similar to FEA results. Second, test data, simulation data, and the difference between the two need to be presented in common 3D geometry that can be played back over time. And third, other pieces of related information, such as the test video of a crash, need to be integrated with all the other results.
The major challenge from the testing side of things is that the measured channels of data from the sensors, the 3D geometry of the object being tested, and the sensor locations on that 3D geometry are disparate pieces of information; there’s no integration, though they may be available individually. While FEA simulation results typically contain all this information, and more, in a single or related files with the interrelationships clearly defined, this is a major problem on the test side, especially as the interrelationships among these pieces of information are missing and need to be created. This capability hasn’t traditionally been needed when testing was used as a pass or fail filter. But when we use the same test results for design or FEA simulation verification, this missing capability becomes critical.
NI INSIGHT first reads geometry information from any MCAD program or the mesh from any FEA package in a virtual reality markup language (VRML) format. VRML is a common format for exchanging discrete 3D geometry information and is easily available as a “save as” option with the .wrl extension from these the MCAD or FEA programs. Then it reads test channel data from LabVIEW, sources like the DIAdem test analysis and report generation package, or any generic test source that can export data to Excel. Engineers can then drag and drop the test channels on sensor locations in the 3D representation. There are also automation capabilities available for this mapping process for a larger number of channels.
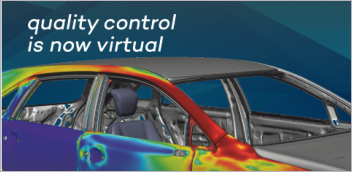
Since test channel data is limited relative to all the geometry nodes available on the model, engineers must interpolate across all the remaining nodes. A color map can now be generated on the 3D model to represent all the information from the test channels, which can also be played back over time. This intuitive way of presenting and analyzing test information is of tremendous value in communicating test information to the rest of the organization. While FEA simulation presents information in this way, it is a new capability on the test side (see Figure 1, above).
The tight integration of products like NI INSIGHT to LabVIEW provide the new capability of creating online 3D visualizations of test results while the test is being performed. This can be leveraged for high ROI test activities such as dynamically changing the test being performed based on the 3D geometry visualization of a large number of test channels. This is often difficult to do based on 2D or 3D online graphical representations. An example of this would be dynamically identifying when flow separation occurs behind an airplane wing, a phenomenon that leads inevitably to a stall condition.
Now that test results can be presented in 3D geometry, it is also possible to compare them with simulation results using a common 3D model. It is also possible to take the differences between the simulation and test and map them onto the common geometry model to play back over time. This means locations and time slices where the correlation errors were high can be easily identified for further investigation—a valuable capability. Figure 3 illustrates how critical location areas and time intervals of poor correlation can be easily identified on a model airplane wing subjected to a structural loading test (see “Correlation in Wing Test,” below, for a detailed explanation).
Finally, there are often videos of physical tests that provide valuable information. These need to be integrated with the test and simulation information. NI INSIGHT provides the ability to read AVI files and synchronize them with test information even though the actual scan rates of the video and the sensor measurements may be different. All this information, integrated and played back together, significantly enhances its value compared to the individual streams of information and allows an organization to extract the most value from such resources. Figure 2 shows how a crash video, with much visual information, can be easily correlated with the sensor measurements from the crash dummy in a common synchronized environment. It helps analysts to better understand the dynamics of the event. An FEA simulation of the event could also be integrated with the test. The Value of Test & Simulation Integration
The test and simulation integration approach can be used to correlate and validate geometry-centric simulations whether they are structural, thermal, or involve other FEA applications. They can also be used for combining fluid-structure simulations where sensors are typically mounted on the structure.
There is a strong need to validate FEA simulations with physical test data to calibrate the models and to make them more useful for making engineering decisions earlier in the product development cycle. A common test and simulation integration and visualization environment is needed that will allow mapping of test channels onto a 3D geometry model and then visualize the test results while also comparing them to the FEA simulation results in an easy manner. This environment will help to quickly identify critical locations and time intervals where the correlation is good and where it needs improvement. It also can be used by all members of the product development team to accelerate the product development process.
Dr. Sugato Deb is the director of emerging markets and partnerships for National Instruments. He has experience with both simulation and test and was instrumental in leading one of the first integrated efforts in the automotive glass industry. Deb received his Ph.D. in mechanical engineering from Carnegie-Mellon University. Send Dr. Deb your thoughts about this article by clicking here. Please reference August 2005 Test & SIm article.
Correlation in Wing Test
A scale-model airplane wing about two feet long was outfitted with 15 strain gauges and loaded at the tip while being clamped at the base. SolidWorks was used for the model wing geometry and the FEA simulation was accomplished using COSMOSWorks. The physical test including control of the tip loading and measurement from the strain gauges was done using LabVIEW. NI INSIGHT was used to read in the mesh geometry, the simulation results from COSMOSWorks, and the test channels from LabVIEW. NI INSIGHT mapped the test channels onto the wing geometry at the locations of the 15 strain gauges and the test results were compared to the simulation results in separate windows as well as the difference displayed.
Figure 3 shows the test data on the top left, the simulation on the top right, and the difference below as a percentage difference and an actual difference. A variation on this example is that instead of measuring strain, pressure distribution is measured on the wing surface while the wing is placed in a wind tunnel at different angles of attack to identify the stall angle.
For more information, a detailed web demo of the model airplane wing example described above, and other technical literature and interfaces between physical test and leading CAE software is available at www.ni.com/design/mechanical. —SD
Product Information
National Instruments
Austin, TX
SolidWorks Corp./SRAC Division
Los Angeles, CA
SolidWorks Corp.
Concord, MA
Subscribe to our FREE magazine, FREE email newsletters or both!
Latest News
About the Author
DE’s editors contribute news and new product announcements to Digital Engineering.
Press releases may be sent to them via [email protected].