H-link unit load model with pin forces and moments. Image courtesy of Wolf Star Technologies.


Latest News
November 1, 2017
By David N. Slowinski of CNH Industrial
Finite element analysis is a useful tool for the evaluation of the structural components of construction equipment. A common approach is to apply static loads to the finite element models to represent loading under normal field operations. The static loads applied often represent “worst-case” forces under those operations. The structure under investigation is then determined to be acceptable or not based on meeting target values for stress, strain, deflection and or some other criteria.
One concern with this approach is that it may miss potential fatigue issues. Estimated fatigue life for a given load can be determined using stress-life or strain-life calculations. However, the dynamic nature of the loading is difficult to reproduce. A single field operation may require numerous static load cases to simulate the complete range of forces applied, and cycle counts are difficult to estimate.
Another problem with representing dynamic loading with worst-case static loads is that it neglects the relatively low strain, but high cycle loads that can result in fatigue problems. Machines such as skid steer loaders (SSLs) and compact track loaders (CTLs) perform a wide variety of tasks that often involve highly dynamic loading. Accurately reproducing these dynamic loads in the finite element simulations greatly improves the confidence in the results of the evaluation and allows the analyst to compare design alternatives effectively.
The finite element modeling capabilities available in Abaqus/CAE allow the analyst to create simulation models that provide accurate response to the applied boundary conditions and loading. The key to using this technology for the fatigue analysis of construction equipment is applying loading that reflects the dynamics of the field operations.
 H-link unit load model with pin forces and moments. Image courtesy of Wolf Star Technologies.
True-Load software accurately duplicates time-history field loads and has a user interface that is directly integrated with Abaqus/CAE. A unit load model, in which any possible load path into the structure is represented by a unit load, is first solved in Abaqus to determine strain response to the unit loads. True-Load/Pre-Test then uses the strain response to determine optimal strain gauge locations that effectively turn the structure into its own load transducer. Strains are then recorded at the True-Load strain gauges during field test. The test strain data is then read into True-Load/Post-Test to determine the time history load functions by calculating the scaled unit loads that recreate the strains produced during the test.
Once the time-history loading is determined, the full field response of the structure is determined by applying the scaled loading in True-QSE, which superimposes the time-history loading on the unit load model. The time-varying stress, strains and deflections are determined at each node and element of the structure. True-Load/Post-Test also has built-in functionality to automatically output the time series loading in fe-safe format so that fatigue analysis of the structure can be completed.
In the case study presented in this paper, design alternatives for a front-end loader linkage were evaluated by the linear static FEA approach as described above and by an approach utilizing True-Load software to recreate field loading on the Abaqus FE model. Once accurate field data were applied to the model, Verity weld fatigue analysis was used to validate a design that met the simulation durability target.
Background
Skid steer loaders and compact track loaders are used in the construction, landscaping and agriculture industries and perform a variety of tasks. The current product line for Case Construction and New Holland Construction SSLs and CTLs include machines with either radial lift or vertical lift loader assemblies.
The radial lift machines employ a loader arm that pivots about a single axis of rotation on the chassis and lift cylinders to raise and lower the arm along a radial path. The vertical lift loader arm includes linkages that attach at different points on the chassis and loader arm so that the arm raises and lowers along a path with a greater vertical reach, which is more advantageous for certain operations.
An assortment of front-end loader attachments are available that allow an operator to perform a wide range of jobs. These various field operations create a challenge for the analyst to validate designs through simulation.
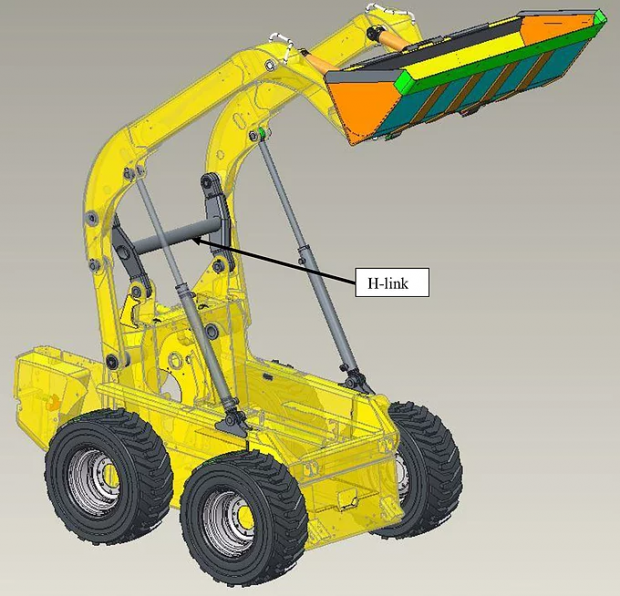
The purpose of this project was to validate a design solution to resolve fatigue failures on the H-link in the vertical lift loader arm assembly. The H-link is a welded assembly that is connected to the chassis at two pins and to the loader arm boom at two pins. Fig. 1 illustrates the CAD geometry for the vertical lift loader arm at the maximum height orientation and assembled to the chassis. The H-link is shown in the dark gray color.
Methodology
It was determined that the failures were occurring on machines used primarily for one particular field operation, which involved the use of a specialized attachment at the front of the loader. Once the primary operation causing the fatigue problems and the failure location on the H-link were identified, design alternatives were developed through simulation prior to a final field test of the recommended design.
Linear Static Loading Approach
The first step in evaluating the alternative designs was to update existing FE models of the current loader assembly design and run linear static loads calculated to be the expected maximum for the operation of concern. To approximate the operation, the models were run with the loader arm at three orientations and various load scenarios were applied at these orientations.
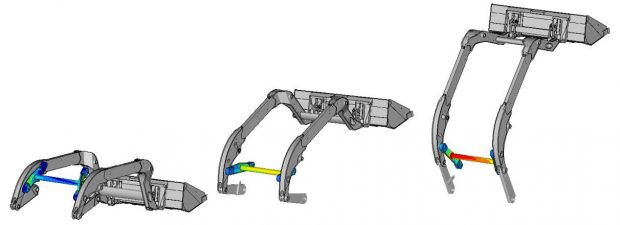 H-link stress contours under static load cases and three orientations.
Stress values were compared for the current design and for the alternative H-link designs. Stress-life calculations were then used to estimate the expected life improvement of the design alternatives. The target life improvement was determined by comparing the number of hours to failure against the desired number of hours for the operation. Fig. 2 illustrates the stress contours of H-link with the loader assembly at the three orientations with one of the static load cases applied. The design developed through this approach was later evaluated with field loading, but it did not meet the goal for the number of hours for the operation.
True-Load Approach
To increase confidence in the simulation results, a better understanding of the loading for this operation was required. An Abaqus/CAE unit load finite element model of the current H-link was created. The mesh consisted of shell, hexahedron and beam elements. Because the only load paths into the H-link are through the four pin locations, the model was set up with unit loads at each of the four pin joints. Each joint is free to rotate in the direction of the pin axis (in the model Z direction), freeing up 1 degree of freedom.
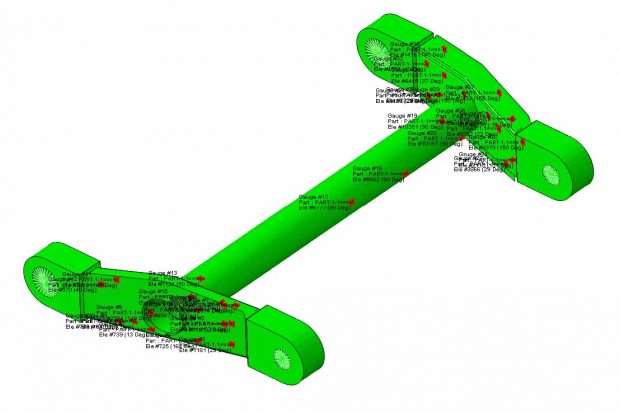
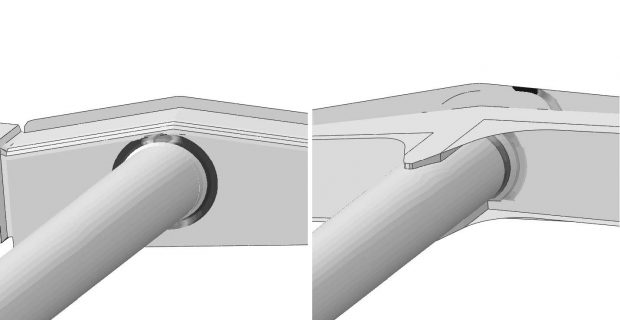
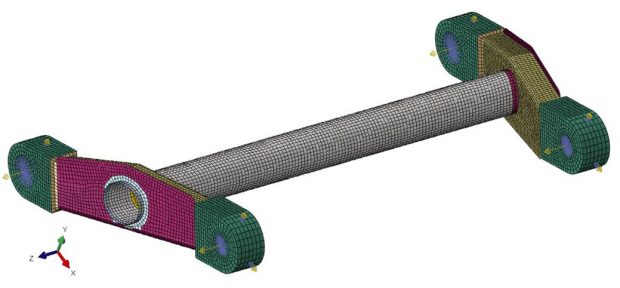 H-link unit load model with pin forces and moments.
Unit loads were applied for each of the 5 remaining degrees of freedom, three force unit loads in the X, Y and Z directions and the two moment unit loads orthogonal to the pin axis in the X and Y directions. Inertia relief was included to prevent rigid body motion. This resulted in twenty unit load cases. Fig. 3 shows the unit load model with the forces and moments applied at each pin in Abaqus/CAE.
A linear perturbation analysis was solved in Abaqus/Standard and the result file loaded into True-Load/Pre-Test, which determined the optimal placement of the 33 strain gauges it determined were needed to accurately reproduce the loading based on the strain field for all unit loads. Fig. 4 shows the Abaqus/CAE H-link unit load model with the strain gauge locations as identified by True-Load.
 H-link unit load model with strain gauges placed by True-Load.
Through the True-Load user interface, the analyst can easily relocate gauges and place dimensions to the gauges directly on the Abaqus/CAE model. This ensures the gauges will be placed on the physical part in the correct locations determined by True-Load and that the gauges are placed in accessible areas where they will not be damaged during test. A STEP file of the H-link geometry was read into Abaqus/CAE so that dimensions could be placed relative to actual part surfaces as opposed to the mid-surfaces where the shell mesh was placed. Fig. 5 shows one of the True- Load strain gauges dimensioned on the Abaqus/CAE model and the location marked on the test part.
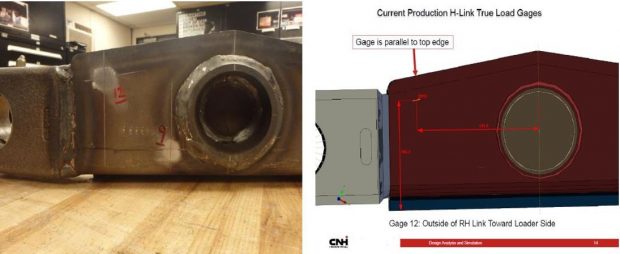 True-Load gauge dimensioned in Abaqus/CAE and located on test part.
After the True-Load gauges were placed, a field test that duplicated the operation of concern was completed and the strain results were loaded into True-Load/Post-Test. The load functions were then calculated and output in fe-safe format for subsequent fatigue analysis. The load scale factors were then used in True-QSE to use superposition of the load functions on the unit load model to simulate the field loading on the entire H-link FE model.
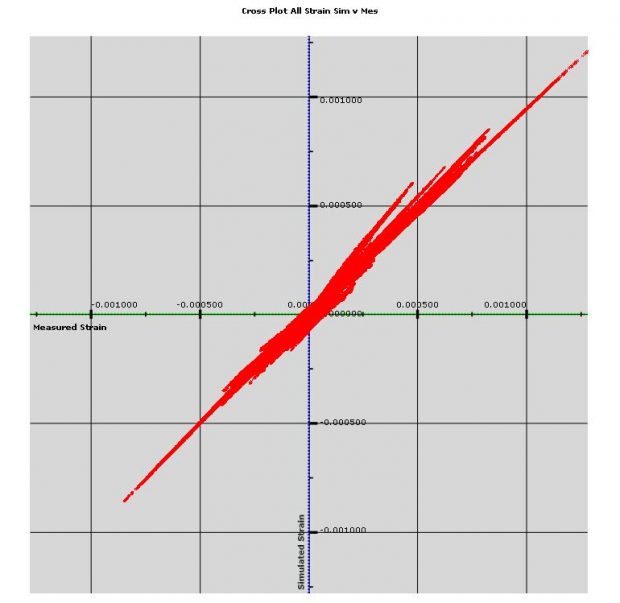 Strain correlation plot between simulated strain and measured
To confirm that the simulated strains are correlating well with the strains measured during test, True-Load/Post-Test produces a detailed summary of the analysis that includes True-Load gauge correlation results. For the H-link, the report indicated excellent correlation with the worst True-Load gauge producing 10.3% Root- Mean-Square (RMS) error and the best producing 0.14% RMS error. To further illustrate the excellent correlation results, Fig. 6 shows the cross plot comparing the simulated strain to the measured strain for all 33 of the H-link True-Load gauges.
In addition to the True-Load gauges, strain gauges were also placed in the expected low life locations. The ability to load the entire model with the time series loading in True-QSE means that the time-varying stress, strains, or deflections at any point in the model can be determined for the field operation. Fig. 7 shows a segment of the time trace comparing the simulated strain from the Abaqus model to that same time segment at one of the gauges in the expected low-life location. The nearly identical strain traces greatly improved the confidence that the simulation model was accurately duplicating the strains produced on the entire H-link.
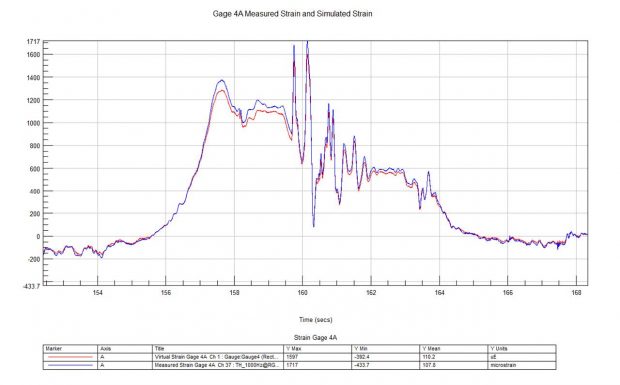 Time trace comparing simulated strain to measured strain at low life location.
The next step in the current production H-link analysis was to complete the fatigue analysis. The loading histories as determined by True-Load/Post-Test and the Abaqus odb results file were loaded into fe-safe. The fe-safe results were created in a new odb file that could be opened and post-processed in Abaqus/CAE. The initial fatigue model for the current production design indicated the lowest life was expected near a weld that connects the cross-tube to the side arm of the H-link. This matched the failure location on the field machines. The Abaqus/CAE model was then updated to include shell elements to represent the weld at the interface between the cross-tube and the side arm. Verity weld fatigue was then run in the fe-safe analysis and the predicted number of hours was similar to the number of hours to failure.
After creating the current production model that correlated well with the failure location and number of hours, the next step was to analyze new designs to determine the solution that will meet the simulation goal. An Abaqus/CAE unit load model was created for the new design with the same unit loads applied as the production H-link model. After solving the unit loads in Abaqus/Standard, the results file and the same time series loading produced for the current production H-link were loaded into fe-safe.
 Life contours of the current production (left) and the final design (right) from Verity weld analysis in fe-safe.
The initial results again showed the lowest life location near the weld that joined the cross-tube to the side arm of the new H-link. Verity weld fatigue analysis was again used to determine the predicted fatigue life at the weld for the new H-link design. The result was that the new design met the simulation goal with an estimated fatigue life improvement of 7.8 times over the current production design. Fig. 8 illustrates the Verity fatigue life contours comparing the current production design to the final design.
Conclusions
The integration of Abaqus/CAE, True-Load, and fe-safe allowed for an efficient and thorough investigation of the H-link design. Abaqus accurately reproduced the behavior of the H-link under the field loading conditions. True-Load created very accurate duplication of the field loads that could then be used to correlate the current design to actual results and to validate alternative designs. The correlation between simulated and measured strain significantly increased the confidence in the results of the simulations.
Finally, the ability to use actual time-history loading in fe-safe provided accurate fatigue life estimates of the entire H-link assembly. Correlation of the Verity fatigue analysis to the failure location and number of hours provided an additional level of confidence that the fatigue analysis of the new design was accurate. A final field test validated the results of the simulations and confirmed that the new design met the durability goal for the field operation.
The ability of Abaqus/CAE to produce accurate strain response combined with the ability of True-Load to reproduce the dynamic nature of field loading is a very valuable tool in the development of construction equipment structures. Together with fatigue analysis in fe-safe, these tools provide a method for engineers to virtually design structures and be confident that they will meet durability criteria.
The ability for these tools to communicate means an efficient process that will identify potential fatigue issues before parts are made. The need to spend time to adjust static loading scenarios to match test data is eliminated. In addition, the entire structure is evaluated under actual time series field loading, as opposed to isolating the focus of the simulation to a single location. The process reduces the number of design and test iterations. The overall impact is a reduction of development time and cost.
David N. Slowinski is project engineer at CNH Industrial.
More Info
Subscribe to our FREE magazine, FREE email newsletters or both!
Latest News