

Latest News
March 1, 2005
By Keith Crowe
Tecplot Inc.—formerly Amtec Engineering—recently released version 10 ofits multiplatform plotting and scientific visualization program,Tecplot. I’ll divide this brief review into two parts: a generaldescription of Tecplot and a closer look at some of the features addedin the new release.
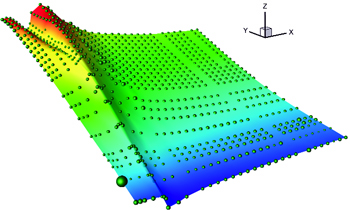
Theresults of several hundred Cart 3D simulations of the Liquid Glide-BackBooster (a conceptual design for a new, reusable launch vehicle forspace exploration) visualized with Tecplot. The plot shows thevariation of lift, speed, and angle of attach. Each sphere represents one CFDrun sized by the number of iterations in the run.
Learning CurveHelped by Online Tutorials
Tecplot is a data exploration tool, producing 2D/3D graphical views ofdata. A huge number of options are available, from the simplest x,yplots to finite-element grids and volumetric data.
Data preparation and conversion often present significant barriers tothe effective utilization of information. This is especially true invisualization and is the reason why the better plotting packages supplyloaders for a variety of types. Tecplot is no slouch in this regard.There is an ASCII load format that is well documented, reasonablystraightforward, and with a bit of postprocessing, much existing datacan be coaxed into the program this way. There are also loaders builtinto Tecplot to handle many other standard formats, including Excel,DXF, Fluent, and DEM (though not SDTS-formatted DEMs) and others. Ididn’t list your favorite? Not to worry. The package is extensiblethrough user-written add-ins.
Once loaded, you interact with your data inside of the Tecplot WYSIWYGenvironment. The UI has a generally intuitive feel, which helps keepimpatient, non-document-reading users like me from running to thenearest fire exit, at least right away. A workspace appears when youstart Tecplot. Multiple frames with individual plots and annotationssit on the workspace. Properties of plots (mesh, contour, shading, andso on) are changeable with a few menu selections. After adjustingeverything to your liking, save the whole aggregate as a single layout.
I don’t want to make Tecplot seem trivial to use. Please do plan on alearning curve, particularly with respect to the data hierarchy. Forexample, the frame mentioned above is associated with a data set, thedata set with one or more data files, and the data file possiblysubdivided into zones. Complex relations between frames can beconstructed, as an example, which have multiple frames that provideunique views of the same data set. Zones are used to handle complexconfigurations or to conveniently subdivide data.
It’s difficult to brag about your nice plot until it’s exportedsomehow. Tecplot supports many vector and raster formats, includingEPS, HPGL, BMP, TIFF, and so on. Movies can be created as well. Tecplotdata files are interchangeable between Unix and Windows versions of theproduct.
|
|

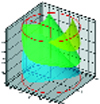
Figure 1: An isosurface plot created with Tecplot 10.
Figure 2: An example of a streamtrace plot as created in Tecplot version 10.
Figures 1 and 2 (above) show the isosurface and streamtrace plots, which the onlinetutorials help you create.
What’s So Great About V10.0?
The latest release concentrates improvements in three areas: plottingtools, data management options, and interface improvements. Let’s tickoff some of the new items.
Multiple contour variable options allow assignment of differencevariables to different regions of data. Multiple contours for aspecific region can also be displayed.
Among other new plotting features are new polar plots, anti-aliasing(smoothing out the jagged edges), and 3D scatter plot symbols. A longoverdue addition is the new ability to import image files, such as amap or picture.
Tecplot 10 introduces the notion of a data journal, which recordssuccessive alterations in layout files. When a file is reopened, thealterations are applied. Think of this like what’s been happening insource code management for years. You have a baseline file and a seriesof ordered changes, allowing easy return to specific configurations.
Extra, descriptive information can also be attached to data files. Andthere is now variable and node map sharing in some of the data loaders.
I’m bolder now with my modifications given the new Undo feature is justa click away. It’s available for style, data, and view changes. Thereis also a slider to control the lossiness of JPEG export, really handyin preparing images for the Web. Continuing the export enhancements,flash (SWF) animations can be constructed. Drop the animation on a Webpage and anyone with a freely available viewer, such as QuickTime, cansee the results of your work.
 Active Message Board
I’m running Tecplot on Windows, but you can order it for various otherplatforms as well. At this writing, expect to pay $1,600 for a singlelicense. My order arrived in, quite literally, a black box, withlicense information, one rather concise user’s guide, a bit ofmarketing cross-sell material, and the disk. There are release notes,but the print is so fine that, not having the visual acuity of afighter pilot, I found them functionally illegible.
There was an installation glitch the first time around, with prior datafrom my system environment path vanishing. But I did two laterreinstalls, and this didn’t happen again. This wasn’t too serious, andyou can reasonably expect to go from opening the box to a fullyfunctional install in just a few minutes.
Support fortunately goes far beyond what’s in the box. The onlineresources available at Tecplot’s website are very good. I’d encourageeveryone to go browse around. There’s loads of free information,including several animated tutorials. I hit a couple of snags but foundsolutions quickly on the support site. There’s even access to asearchable message board for Tecplot users. People really are using it,with more than 1600 postings so far.
Thumbs Up
If you’re happy with the simple plots available from many sources, MSExcel for example, don’t bother changing. But if you find your needsgrowing more sophisticated, then have a look at Tecplot 10. With itslarge variety of plots, high level of available customization, andextensive import/export facilities, it should meet the needs those whoneed moderate to complex functionality.
Keith Crowe works in time series analysis and forecasting RandD atSAS Institute Inc. (Cary, NC; sas.com), and has extensive experience inmathematical and scientific computing and geographic informationsystems. Send Keith your comments about this article via e-mail to[email protected].
Subscribe to our FREE magazine, FREE email newsletters or both!
Latest News
About the Author
DE’s editors contribute news and new product announcements to Digital Engineering.
Press releases may be sent to them via [email protected].