Latest News
August 1, 2005
By Phil Fraher
Since John Mauchly and John Presper Eckert Jr. introduced the world’s first electronic general-purpose data-processing computer in 1945, high-performance computing (HPC) has fundamentally changed the world of mathematics and statistics. Since the introduction of the Electronic Numerical Integrator and Computer (ENIAC) so many years ago, supercomputers have also been instrumental in helping scientists and researchers perform complex analytics. Without this combination, we’d be hard pressed to perform complex calculations, such as predicting tomorrow’s weather, very quickly. The following is a brief discussion about the evolution of HPC and its influence on analytics.
The Advent of Super Computing
A supercomputer is a computer that can process hundreds of millions of math calculations per second. Today, many supercomputers sit right on your desk, bringing with them an entirely new paradigm for high-performance computing. In 1945 though, the ENIAC occupied 1,800 square feet of space and weighed more than 60,000 pounds. It contained a few thousand vacuum tubes that had to be replaced each month by technicians. Among ENIAC’s first computing tasks was calculating ballistic data (plane height, target distance, wind velocity, bomb weight, etc.) to produce firing tables for the US government. Mauchly, a physicist, and Eckert, an engineer, soon replaced the ENIAC with the Universal Automatic Computer (UNIVAC), which became the first supercomputer available for commercial applications. By 1957, more than 40 UNIVACs were in use across the country.
|
|
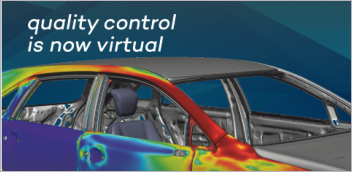
| This image shows how PV-WAVE from Visual Numerics can be used to display and analyze computational fluid dynamics (CFD) data. In this image, the flow around a wing is simulated and displayed. |
In 1972, Seymour Cray, who played a key role in designing subsequent UNIVAC models, spun off his own company, Cray Research, to build another brand of supercomputer. His first design, the Cray-1, performed an average of 240,000,000 calculations per second. By 1985, the Cray-2 was performing 1.2 billion calculations per second. By comparison, today’s cell phones have more power than the Cray-1 and are much cheaper to run than the Cray’s approximate $1,000 per hour cost. Organizations able to afford a supercomputer back then, such as government agencies and research labs, often leased it to other companies for a handsome fee. It was a concept known as time sharing, meaning only larger companies or organizations could afford to perform complex analytics.
Clustering and Grid Computing
Today, scientific labs and businesses can access supercomputing power through clustering and potentially grid computing. This fundamental shift has helped fuel the growth of business analytics—the ability to apply advanced analysis and visualization techniques to real-world business problems. Once only available to the supercomputing arena, this practice has led to timely, insightful, sophisticated, and accurate decision making.
The genesis occurred in 1996 when a group of physicists at IBM performed one of the largest single calculations ever. They solved one trillion mathematical subproblems by running more than 400 computers continuously for two years. Essentially these physicists used clustering—the practice of linking similar desktop systems on the same platform with high-speed bandwidth between processors—to improve time-to-analysis. Today, companies requiring advanced analytics are doing the same. They are achieving high-performance computing power by clustering; a much more cost-effective practice than purchasing a supercomputer.
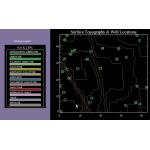
|
|
| This image shows an analysis of well information displayed as shaded polygons. PV-WAVE was used here to show the possible location of an oil reservoir. |
In addition, grid computing—leveraging different computers on multiple platforms to achieve supercomputing power—is another option for performing advanced analytics cost effectively. The challenge here, however, is managing multiple platforms. Incompatibility issues can cause performance glitches even if the computing power of the grid is adequate. In addition, incompatibility issues can affect the accuracy of the analysis. However, with the emergence of Java, some of the incompatibility problems with grid computing can be overcome relatively easily, which is helping Java become a more feasible option. Java’s platform independence alleviates issues pertaining to the distribution of an application across a heterogeneous environment where you have variations in operating systems and compilers as well as differences in data formats.
Without HPC, Forget Timely Advanced Analytics
No matter whether you use a traditional supercomputer, a cluster, or a grid, high-performance computing is essential to sophisticated analytics in science, engineering, and business. As data set sizes grow exponentially, high processing power is required to manage the complexity of the data by processing large and complex data sets simultaneously and quickly. That way, uncovered information remains useful for timely decision-making. This essential part of high-performance computing is called parallel processing. Without it, many of the advantages of cluster and grid computing would be lost. The larger and more complex the data set, the more important high-performance computing is to obtaining fast results.
For example, let’s say you need to analyze terabytes of weather data to determine when the next hurricane might hit Florida. Without adequate computing power, bandwidth, processing speed, and the ability to simultaneously process the data, the results might take days or even weeks to complete. By that time, the hurricane will have come and gone, and the data will be useless.
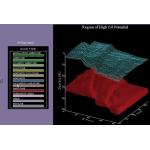
|
|
| This image highlights PV-WAVE’s capability in displaying the topology of a region, pinpointing oil well locations. |
In medicine, high-performance computing coupled with advanced analytics allow doctors and researchers to solve complex problems much faster than even a few years ago. By simultaneously computing multiple data sets, they can determine numerically the effectiveness of the treatment for a particular disease, and visualize that data in color on 3D charts. They can also interact with the data in real time and apply predictive analytics to forecast potential outcomes. By refining their analytic models to introduce more variables, they can achieve even more accurate results. The possibilities are endless.
New Kids on the Supercomputing Block
For the first time in the US, we are seeing commercial services like banks using high-performance computing. Higher speeds mean faster analytics for their customers, and they remain competitive. This year, for example, CS First Boston was the first financial services company ever named on the Top 500 Supercomputer Sites for 2004.
In China, we are also seeing tremendous growth in high-performance computing and analytics in just the last few years. While China still lags behind the US, it is rapidly gaining ground in the areas of oil, gas, and aerospace. Chinese universities and research centers are buying individual computers for clustering as well as supercomputers from Hewlett-Packard and IBM, the most dominant hardware vendors in Asia. But since 80 to 90 percent of China’s IT budgets go toward hardware, they have been developing the analytic software and mathematical and statistical libraries themselves to cut down costs. Now they are starting to realize the value and time savings of buying analytic software and numerical libraries that are already fully hardware compatible.
At this year’s SC 05 SuperComputing conference (November 12-18) in Seattle, more software vendors are expected to exhibit than ever before. In addition, a new initiative is emerging called HPC Analytics, which is at the forefront of promoting advanced analytics in high-performance computing. This year, SC 05 is offering the first annual HPC Analytics Challenge. The number of submissions has been high and ranges from scientific research at national laboratories to the music industry.
Companies have come to the realization that computing power, bandwidth, and processing speed can only take you so far. As a result, high-performance application development is becoming more critical to all facets of science and business; and tools such as sophisticated numerical libraries are becoming the backbone to the performance of those applications. Numerical analysis is not just for supercomputing gurus anymore—more and more mainstream companies are seeking advanced analysis and visualization tools for these types of solutions.
In fact, 15 years ago after graduating from Auburn University with a degree in computer engineering, I joined the research team of a major oil company. At that time, oil exploration was done mainly via paper maps, and software engineers like me were considered inferior to the geologists and petroleum engineers. By the time I left, we had helped transform the paper-based analysis to the computer platform and had earned the respect of the researchers. It became clear to the researchers that the advantages of running sophisticated software models for quick and accurate results saved engineering time and provided the ability for expanded analysis capabilities.
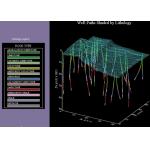
|
|
| Here, a 3D surface and 3D line plots demonstrate the software’s interactive z and x axis controls, showing well paths shaded with variables (i.e. Sonic, Gamma, Lithology). |
The truth is that the advances in computing power, bandwidth, and processing speed have provided the foundation for advanced analytic software solutions to take the stage and bring us to the next major crossroad in advanced computing.
The Future
In the next five years as high-performance computing becomes cheaper and easier to manage, and as company data grows exponentially, we will see more commercial enterprises using supercomputing capabilities in new computing configurations to process and analyze mountains of information. As supercomputing evolves, so will analytics. And in the next 10 years, even “mom and pop” shops will be able to perform advanced predictive analytics to gain better insight into their customers and their future.
Phil Fraher is the President and CEO of Visual Numerics, Inc. He has a BS in computer engineering from Auburn University and an MBA from the University of Rochester. Earlier in his career, he was a software engineer at Exxon. Send your feedback via e-mail by clicking here. Please reference Number Crunching September 2005 in your message.
Subscribe to our FREE magazine, FREE email newsletters or both!
Latest News
About the Author
DE’s editors contribute news and new product announcements to Digital Engineering.
Press releases may be sent to them via [email protected].