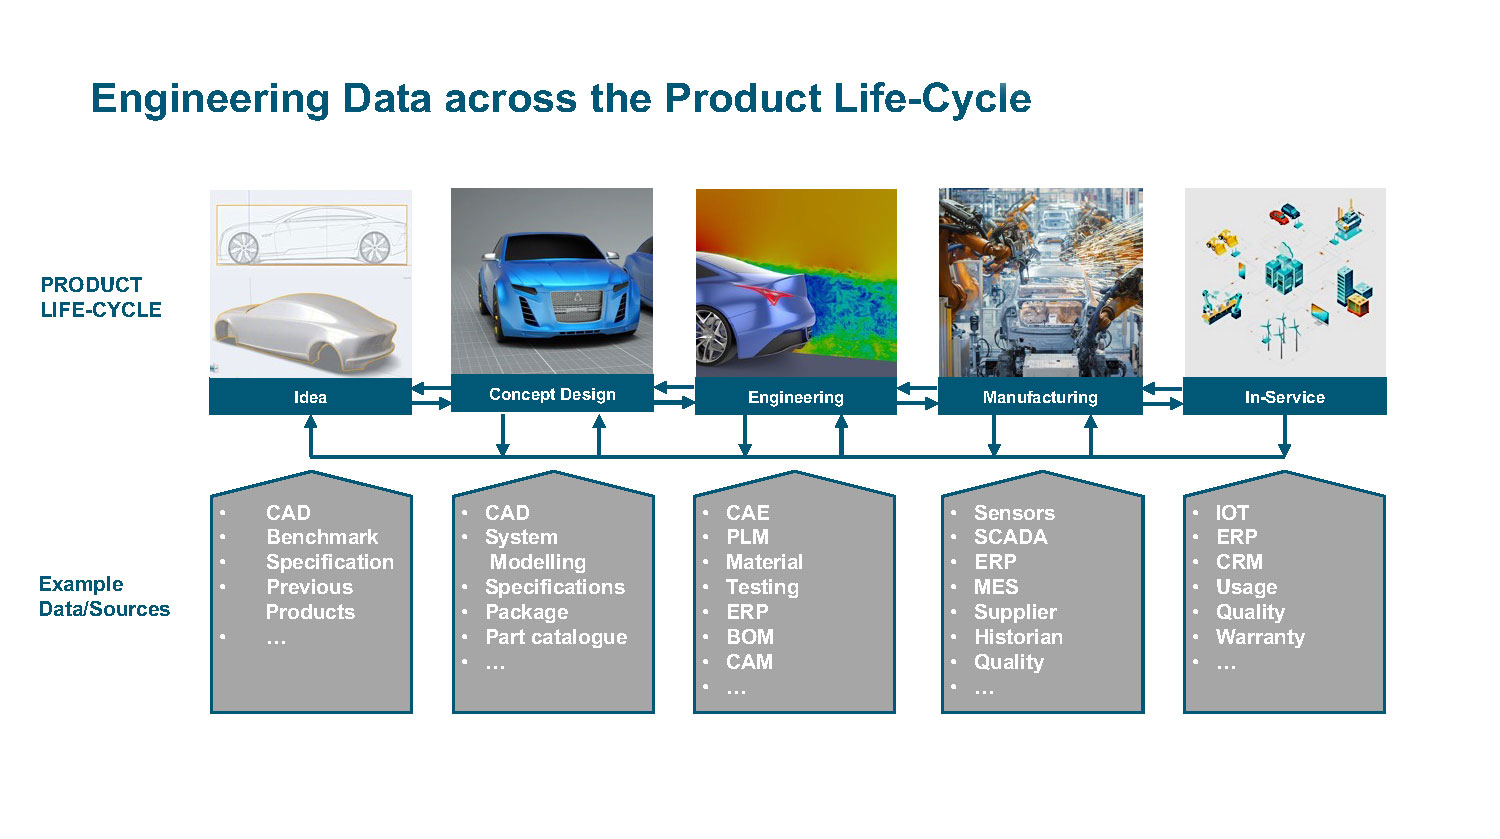
Fig. 1: To successfully apply analytics to digital thread data, companies must think of the whole process as a system, not as a series of individual functions. Image courtesy of Altair Engineering.
Analytics: The Next Piece of the Digitalization Puzzle
Data collection is not enough; companies must have the right framework and tools in place to gain insights and improve operations.


Latest News
June 8, 2022
Companies are beginning to realize that collecting massive amounts of data to create digital threads is just the first step to obtain transformational value from their myriad data sources. To become competitive in the digital age, organizations must cultivate a comprehensive analytics capability, often leveraging the power of artificial intelligence (AI).
The value of the analytics capability comes into play, however, only when the insights derived from the data are actionable. This occurs when companies convert raw data into information that can be used to enhance decision making and process optimization.
Diversity Is the First Hurdle
Making data actionable, however, is easier said than done. While the market offers a rich assortment of analytical software tools, no one size fits all.
“We have hundreds of disparate systems, with information in different formats: structured, semi-structured, big and small, static and real time, physical and virtual (Fig. 1),” says Marco Fliesser, technical director of data analytics, EMEA, at Altair Engineering. “The diversity of data sources shows how complex it is to host all functionalities in a single tool. This is why there are many products in the market that serve a specific need not only when it comes to different data sources, but also for the different steps in the data analytics process.”
Begin with a Multistep Solution
To overcome the challenges posed by diversity, companies must adopt a multistep approach to analytics that begins with improving the quality and quantity of data.
“This multistep approach requires user-friendly tools for the data preparation and understanding, predictive modeling and visualization steps,” says Fliesser. “As a rule of thumb, approximately 80 percent of the analytics process is spent in data preparation. The problem is that data is often siloed in various file and storage types, and the data quality is too poor for statistical analysis and machine learning [ML]. Having the ability to quickly and easily cleanse and transform data ensures decisions are made based on complete, high-quality data rather than a flawed subset.”
Before getting into modeling and ML, however, users must clean up the data to convert it to usable information.
“Users can’t go from big data to granular insights without first doing some feature engineering and variable selection to find their most predictive characteristics,” says Fliesser. “This can incorporate many approaches, including univariate analysis, bivariate analysis, understanding distributions and outlier detection.”
At the Heart of Analytics
Once data preparation is complete, users can move on to the next step in the process—modeling. This stage is all about building models to answer specific questions associated with the application at hand. At this point, companies have numerous toolsets from which to choose. These tend to fall into one of four categories:
- Descriptive analytics, which aim to understand an existing situation
- Diagnostic analytics, which underscore why a situation or condition is occurring
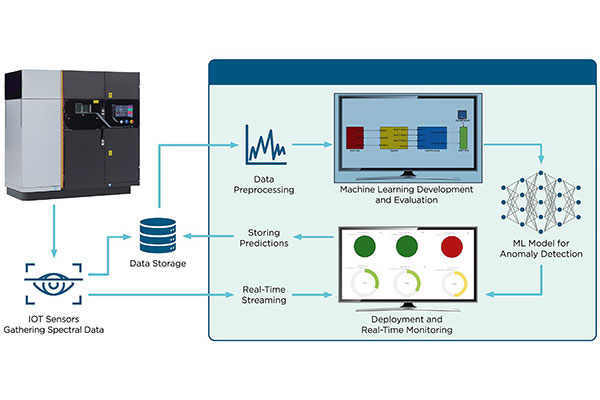
- Predictive analytics, which attempt to determine when a negative event will occur (Fig. 2)
- Prescriptive analytics, which suggest the next best action based on a given event or condition.
Most companies begin with a simple analytics initiative, such as monitoring the state of a machine on the manufacturing floor, and gradually expand efforts to more complex analytical tasks.
For complex tasks, companies can turn to advanced and predictive analytics, which include statistical software and data mining tools. These software platforms use various techniques to create, test and execute statistical models. Certain situations use ML, regression, neural network, rule induction and clustering techniques.
AI software helps develop complex models and applications that mimic human cognitive abilities. These platforms can include advanced ML development and operations tools that include pretrained AI models that help users automate ML and deploy models into business or production processes.
Because engineers have a solid mathematical understanding, but often lack the coding skills that data scientists use to run these studies, the market now sees increasing demand for no-code solutions, providing engineers with more accessible analytics tools. These tools offer a multitude of ML algorithms that users can implement to gain insights.
Visualizing Data
The final stage of the analytics workflow involves data visualization. This is usually where the findings of the whole process are made accessible to business users via dashboards, or where ML models are implemented into use cases. Visualization aims to give users a true understanding of the structure, interrelationships, causal links and outliers in data on a continuous, real-time basis.
To succeed at meeting these goals, visualizations must be able to communicate effectively with users that have varying levels of subject matter knowledge, areas of interest and experience using the software.
“Depending on the task at hand, users need different types of visualization to complete their analysis, gain insights and make decisions,” says David Williams, vice president of global product marketing, data analytics and planning, at SAP. “These users have a range of expertise working with analytic tools and also have different use cases.”
To meet these diverse demands, analytics platforms offer various visualizations out of the box. Their usefulness, however, often depends on whether users can extend the platform’s visualization feature set using open-source software. The idea is to enable the creation of custom analytical applications and widgets using technologies such as JavaScript.
“The visualization features required really depend on the problems that you are trying to solve,” says Chris MacDonald, head of AI and analytics at PTC. “If you are a data engineer or data scientist, you want tools that help you explore and experiment with the data to better understand what is there, if it is good quality and how it is captured. If you are a business user, then the visualization should put information or insight in the context of how you perform your job.”
Visualizations should update in real time no matter the frequency of the data from different sources, and they should support multiple deployment options.
“Visualization tools should be deployable on any cloud or on-premises infrastructure,” says Fliesser. “They also need to be data source agnostic—meaning they should have native connectors for all common data sources, including SQL and NoSQL databases, big data repositories, flat files, real-time message queues like MQTT and Kafka, specialized time series databases and open-source languages like Python and R.”
To make sure analytics results are accessible to as many business users as possible, software should have tools to build analytical dashboards and stream processing applications with a point-and-click user interface instead of relying on complex custom coding. The ability to then publish dashboards to a wide audience without heavy IT involvement is a must.
Context Value
An essential element of the analytics workflow, particularly when working with digital thread data, is the development of context. Raw data alone has no value. It represents neither a positive nor a negative condition. Only when context is given to the data can an organization take action.
For instance, if a manufacturer samples vibration data from a shop-floor machine, operators will not be able to interpret the data unless they know what types of vibrations presage a failure. Armed with this context, the engineers can program the vibration readings into a rule-based tool that can alert the operator when an abnormal vibration is detected.
“You need to marry one or more data streams coming from real-world performance and tie it back to the contextual data that helps it make sense,” says Rob McAveney, chief technical officer at Aras. “The flow back of the analytics provides input to the next exercise, whether that be designing a next-generation product or a software update that might improve performance.”
PLM’s Role in Analytics
All of this raises the question: Must analytical tools be a part of the product lifecycle management (PLM) platform used to create the digital thread, or can users combine best-of-class PLM and analytics platforms to extract actionable information?
At this stage of the software tools’ evolution, the consensus is that the best-of-both-worlds approach is most realistic.
“The reality is that it will be a combination of analytical tools that exist inside and outside the PLM platform,” says MacDonald. “There is going to be logic applied against PLM-managed data that a vendor can provide out of the box, and there will be more customer-unique use cases utilizing broader, customer-specific analytics initiatives that require tools that would not reasonably be part of a PLM platform.”
It is important to remember, however, the importance of the PLM-digital thread connection. PLM data is fundamental to digital thread and digital twin use cases. Rich, contextual and asset-specific information is made available via PLM software. Making this data usable helps companies to optimize processes, identify usage patterns and recommend options is all tied closely with processes managed by PLM systems.
Leveraging these factors, PLM vendors constantly push to enrich their platforms’ capabilities—including analytics.
“PLM platforms are evolving to add new data-driven analytics capabilities, where the data managed by the system can be put to work to deliver new insights that solve specific problems,” says MacDonald.
Despite the trend among PLM vendors to expand the reach of their platforms, even to the point of incorporating more analytics tools, there are those in the market who insist that PLM software and analytics should remain separate entities.
“Analytics should be separate because it would be very limiting to rely solely on your PLM provider for analytics,” says McAveney. “While some basic analytical tools should be part of every PLM platform, that shouldn’t be the entirety of your scope of analytics. The best PLM platform is the one that can work with multiple analytics tools and be able to adapt over time to new technologies and new techniques.”
Hurdles Remain
As has already been pointed out, a great deal of the time and resources pertaining to analytics focuses on improving the quality and quantity of data. Even so, these same two elements represent the two greatest challenges to the success of analytics.
“Bad data hinders getting the desired insights and erodes confidence in the results of data projects,” says Fliesser. “Whatever the case, whether it’s internally with lines of business, or externally with customers, low data quality has long-term effects on the data reputation and the reputation of the people who take care of it. We need to ensure high-quality data to ensure high-level trust in the data and decisions.”
According to Information, 84% of organizations see their analytics projects delayed because of incorrect data formatting, and for 82% of organizations, the used data is such poor quality that analytics projects need to be entirely reworked.
Part of the data-quality problem stems from not getting the right input from the right people.
“Solving technical challenges and implementing an analytics system without continuous input from the business domain experts is a common mistake,” says MacDonald. “For example, one of my first attempts at predictive analytics was to build a model to predict the winners of NCAA tournament basketball games.
“I spent days collecting, cleaning and combining data about teams and game results over the past few years. Then, using our automated ML technology I created a model that would predict the winner of a game between two teams,” adds MacDonald.
Based on his validation data set, he says his model was 100% accurate.
“That made me suspicious that something was wrong. After doing some investigation, I found that the model was only using two variables to make a prediction—the points scored by team A and the points scored by team B,” MacDonald says.
“These variables could not be known at the time the prediction was made, so they should not have been included in the model training. A domain expert would have seen this flaw immediately,” he adds.
This is the type of problem that customers face when data science teams work in isolation from the domain experts, according to MacDonald. The data science teams build something technically correct, which solves their view of the problem, but the results won’t work in a real-world situation.
To avoid these shortcomings, digital thread data analytics applications must be viewed as a system and not as just a single piece of functionality. At each step in the system, consideration has to be given to how it will impact other parts of the system.
For example, how will the data for the digital thread be captured—via human entry or an automated system? What happens when data is missing or incorrect? For users of the generated insight, how will uncertainty be handled by a user or by an automated decision process? How will the system improve over time based on the usage of the application?
The bottom line: Creating a virtuous cycle with digital thread data can enable systems that can continuously lead to more and better insights if you consider how the system works toward your goals.
More Aras Coverage
More PTC Coverage
Subscribe to our FREE magazine, FREE email newsletters or both!
Latest News